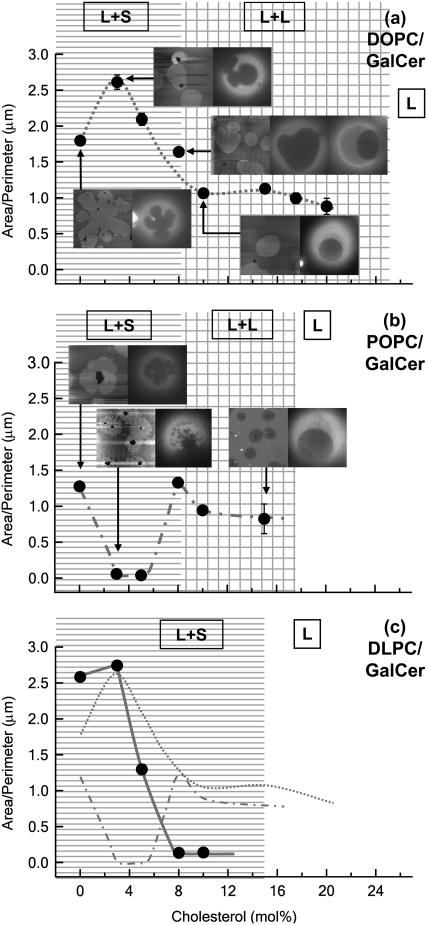
FIGURE 3.
Area/perimeter ratio (A/P) as a function of cholesterol mole fraction and comparisons between SLBs and GUVs. At each point of interest (arrows), an AFM image of an SLB is presented next to a fluorescent image of a GUV that was made of the same lipid mixture. Each image is 20 μm × 20 μm. Phase labels: L+S, liquid-solid coexistence; L+L, liquid-liquid coexistence; L, one liquid phase. (a) DOPC/GalCer/chol mixture. Note that there are two GUV images shown for DOPC/GalCer/8 mol %-chol bilayer. (b) POPC/GalCer/chol mixture. (c) DLPC/GalCer/chol mixture (solid line and data points). For easy comparison between different mixtures, A/P curves of DOPC mixtures (dotted line) and POPC mixtures (dash-dotted line) are also presented.

