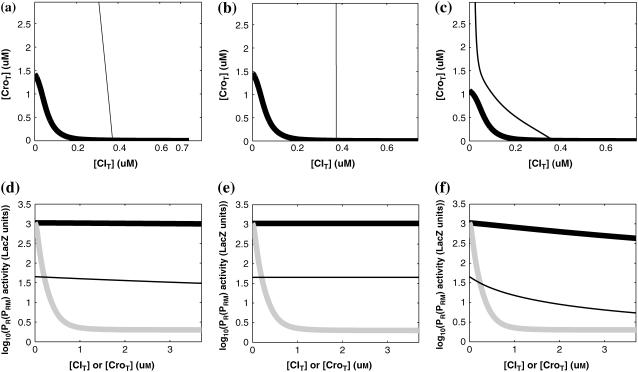
FIGURE 4.
With the variation of parameter  , a–c, plot in the
  versus
  plane of
  curve (thick line) and
  curve (thin line), the cross point of the two curves gives the steady state of the system. (d–f) The activity of
  and
and  promoter change as a function of CI or Cro total concentration. The thick solid line represents
  , the thick shaded line represents
  , and the thin solid line represents
  . In these subfigures, the value of
 is −6.3 kcal/mol in a and d; −3 kcal/mol in b and e, and −8 kcal/mol in c and f.

