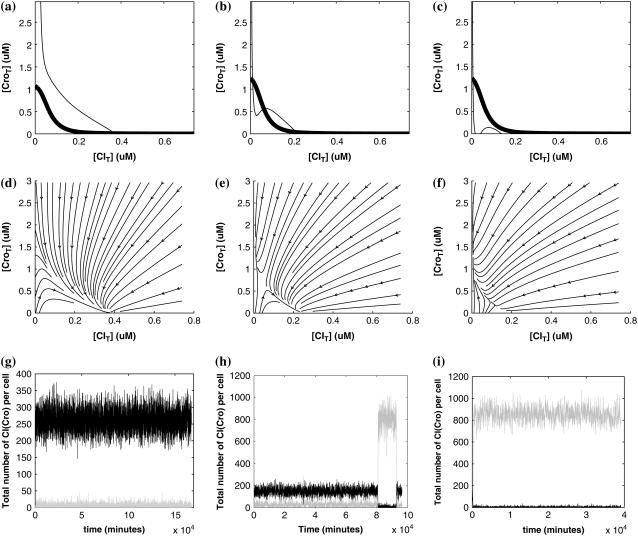
FIGURE 5.
With the change of the control parameter  , the stability of λ-SWITCH is changed. In a, d, and g,
  ; in b, e, and h,
  ; and in c, f, and i,
  . Panels a–c represent the solution line of Eq. 10 in the [CIT] and [CroT] phase space. Panels d–f demonstrate the corresponding projections. Panels g–i indicate the corresponding stochastic simulations of the CI and Cro protein number per cell, in which the solid and shaded lines, respectively, represent the trajectories of CI and Cro protein numbers evolving. Each simulation implements 2 × 10⁶ steps.

