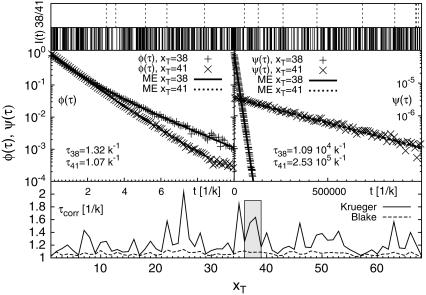
FIGURE 5.
(Top) Fluorescence time series I(t) for the T7 promoter sequence, with tag position xT = 38 (solid lines) and xT = 41 (dashed lines). (Middle) Waiting time (ψ(τ)) and fluorescence survival time (φ(τ)) densities, in units of k. The data points (solid lines) are results from the Gillespie algorithm (master equation). (Bottom) Mean correlation time for Δ = 0. All results are for T = 37°C and 100 mM NaCl with DNA parameters from Krueger et al. (8).

