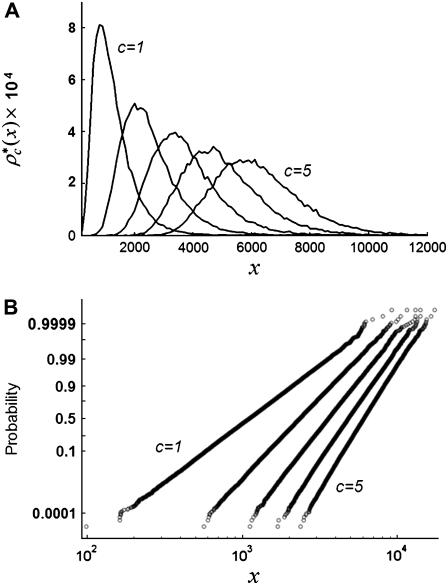
FIGURE 3.
(A) RA basis histograms,  , for c =1−5. (B) Lognormal cumulative probability plots of
  for c=1–5. The slope of the lognormal cumulative probability plot is proportional to the shape,
  . For a RA process, the slope decrease as c increases, which indicates that the relative width of the RA basis histograms decreases with increasing c.

