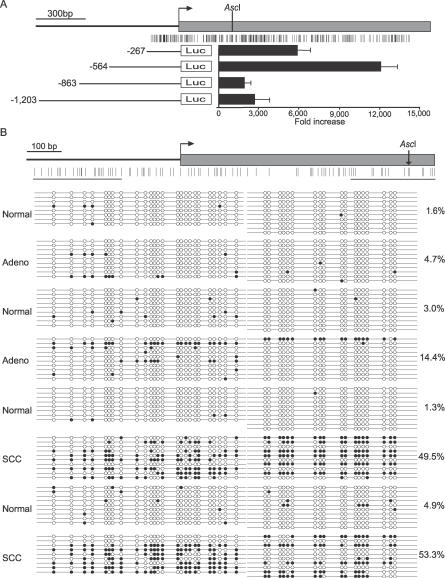
Figure 3. OLIG1 Luciferase Promoter Assay and Bisulfite DNA Sequencing.
(A) OLIG1 gene diagram and luciferase activity determined for four deletion constructs in A549 cells. The gene is represented by a gray box with an arrow indicating the transcription start site. The location of the AscI site is indicated. The E2F3a promoter was used as a positive control for luciferase activity. The error bars indicate the standard deviation of three independent triplicate transfections. The gene diagram and constructs are drawn up to scale.
(B) Bisulfite DNA sequencing of OLIG1 in two adenocarcinomas, two SCCs, and four tumor-free lung samples derived from the same patients. The gene diagram on top indicates the relative location of the sequenced products in relation to the CpG sites within the CpG island (vertical lines), the transcription start site (horizontal arrow), and the exon (gray box). A total of eight to ten clones were sequenced per sample. Each line represents an individual clone and each circle represents a CpG dinucleotide. Solid circle, methylated cytosines; open circle, unmethylated cytosines; vertical arrow, AscI site.

