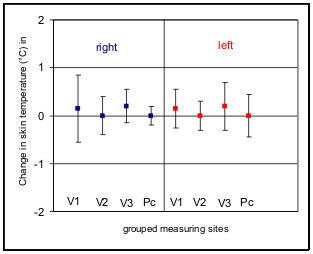
Figure 3.

Means (lines) and standard deviations (bars) of temperature changes following application of a cold stimulus (n = 26). Isoline (0°) indicates mean data from the reference points (glabella). 32 measuring sites are grouped in 8 sites with identical regions of innervation in branches of the trigeminus nerve (V 1–3) and the cervical plexus (Pc) for the right and left side. Overall positive regulation in the areas of distribution of the 1st and 3rd branches of the trigeminus nerve on both sides, no regulation in the other areas. No significant thermoregulation in any area.
