
Figure 5.
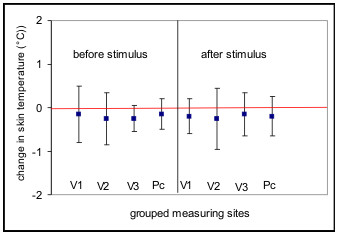
Comparison of the means (lines) and standard deviations (bars) of temperature differences between the right and left sides at the 8 grouped measuring sites before and after application of a cold stimulus for all measurements. References are the measurements of the right sides (red isoline). Abbreviations follow fig. 3. Temperature on the left side of the face being in a mean 0.1°C lower than that on the right side (p = 0,05), before and after application of the cold stimulus.