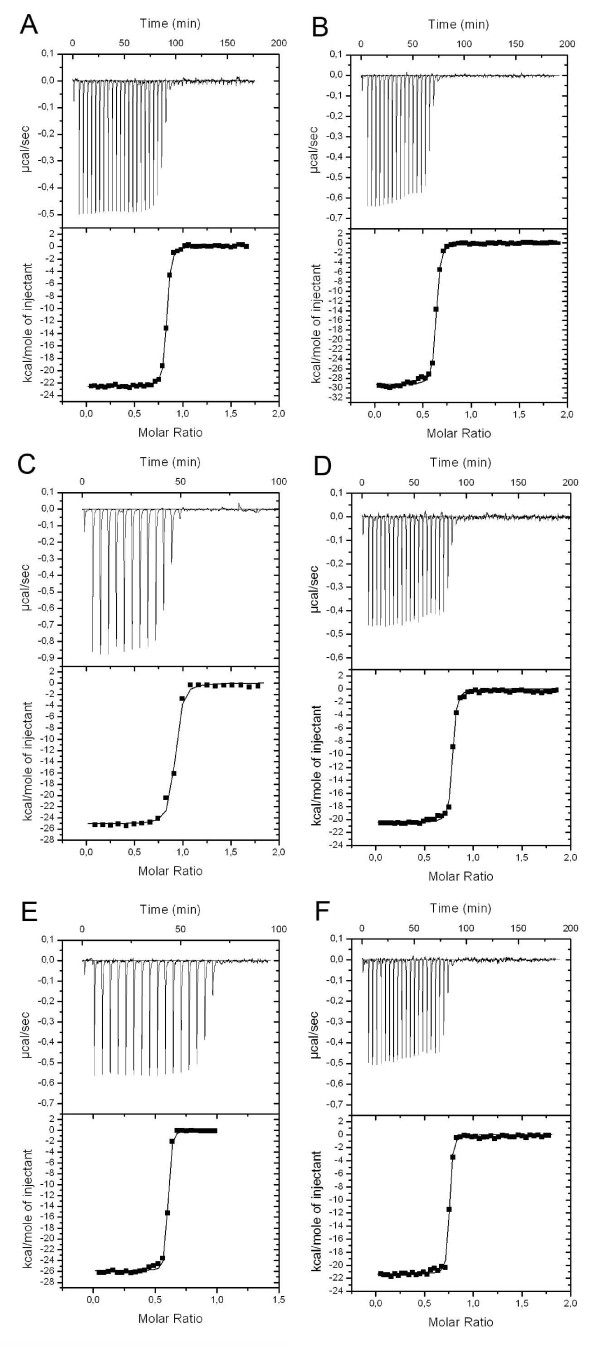
Figure 10.
Isothermal titration calorimetry analysis of bBBP-A and AVD. Binding thermograms measured for (a) AVD-BTN, (b) AVD-BSO, (c) AVD – D-biotin sulfone, (d) bBBP-A – BTN, (e) bBBP-A – BSO and (f) bBBP-A – D-biotin sulfone complexes are shown at the upper part of the graphs. Non-linear least square curves (at the lower part of each graph) were fitted to enthalpies integrated from the individual titrations. For each titration, 0.5 mM ligand solution was used. The reaction volume was 10 μl except for the first titration, which was done in 2 μl.

