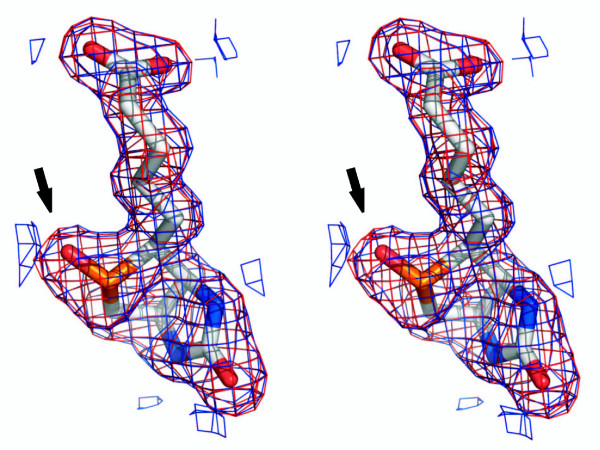
Figure 7.
Stereo image of electron density around the BSO ligand of the BBP-A – BSO structure. The additional oxygen atom on the BSO ligand (in comparison to BTN) is indicated by an arrow. The 2Fo-Fc (blue) and Fo – Fc (red) maps calculated without the ligand but drawn around BSO of the final model are shown at the level of 1.0 and 3.0 sigma, respectively.

