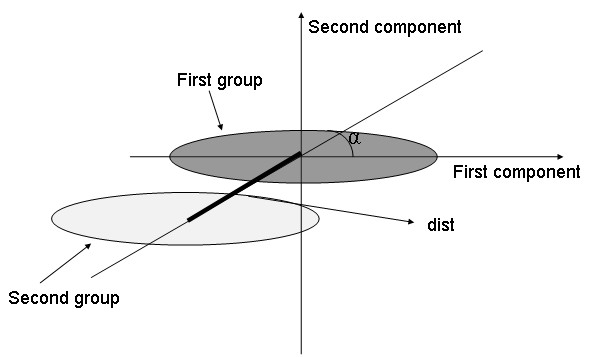
Figure 1.

View of the component space relative to the simulations. The cluster of points of each of the two groups was plotted in the two-component space. The scatter plots barycenters are distant by dist. The direction of the between-group variance draws an angle α with the first component.
