
Figure 4.
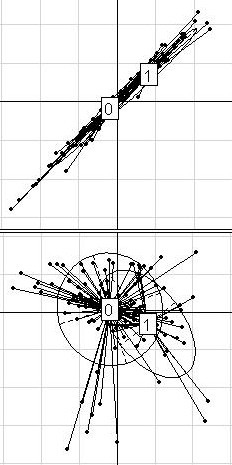
ALL dataset. Projection of the 125 patients from the ALL dataset (24 with and 101 without Multi Drug Resistance -MDR-) on the discriminant axis obtained with BGA (x-axis), along their coordinates on the first (on the top) and the second (on the bottom) within-group PCA component (y-axis), respectively. For a better legibility, the groups were labeled 0 (for patients with MDR) and 1 (for patients without MDR). Only the 50 most differential genes among 12625 were used for these graphs.