Figure 1.

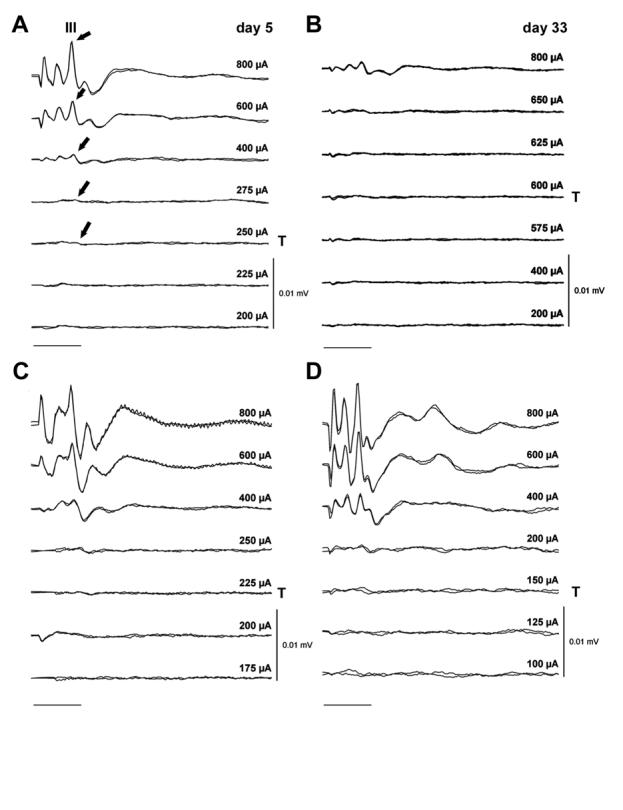
Representative EABRs recorded from an animal in the AP/ES cohort (A and B) and the BDNF/ES cohort (C and D) immediately following surgery (day 5; A and C), and at completion of the 28-day implantation program (day 33; B and D). All EABRs were evoked using a 100 μs/phase biphasic current pulse delivered to bipolar electrode pair 1/2. Two responses are recorded at each current level; each response is averaged from 250 presentations. Wave III of the EABR, from which the threshold data are obtained, is illustrated over its dynamic range (arrows) in the AP/ES responses recorded at day 5 (A). Note the reduction in threshold and maintenance of response amplitude over the implant period for the BDNF/ES treated animal. Peak stimulus intensity (in μA) and threshold (T) is indicated for each set of recordings. For clarity responses from both animals are plotted using the same gain. Scale bar = 2 ms.
