
Figure 4.
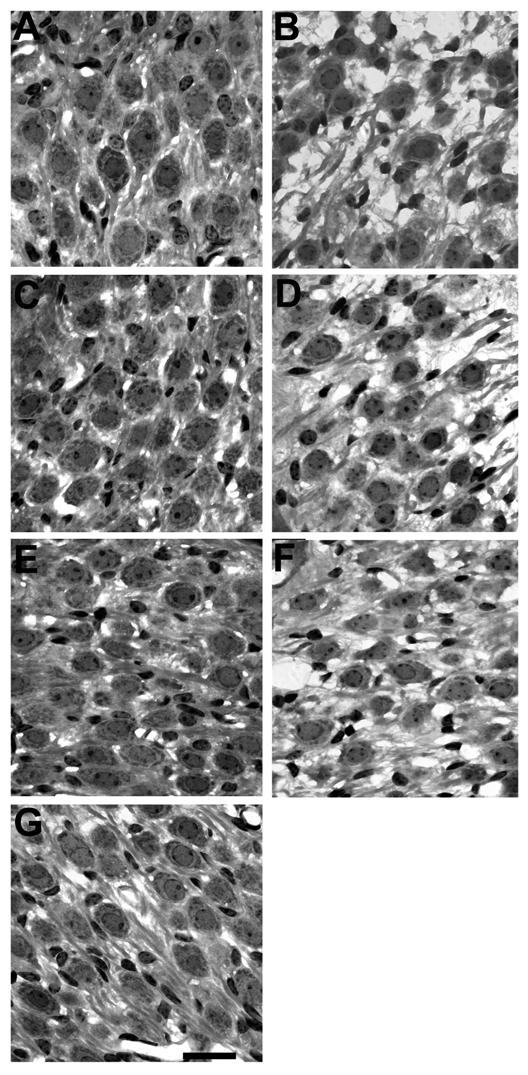
Higher power photomicrographs showing SGNs in the third (A and B), second (C and D) and basal (E and F) turns of a deafened BDNF/ES treated cochlea (A, C and E) and its contralateral deafened, untreated control cochlea (B, D and F). Again, the basal turn of a normal control cochlea has been included for comparison (G). The normal SGN packing density in all three turns of the BDNF/ES treated cochlea (A, turn 3; C, turn 2; E, basal turn), contrasts with the degeneration apparent in the contralateral deafened, untreated control cochlea (B, turn 3; D, turn 2; F, basal turn). Scale bar = 20 μm.