
Figure 7.
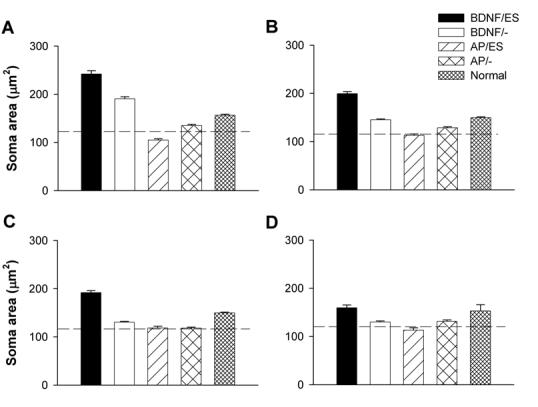
Mean SGN soma area of the treated cochleae for each cohort in this study. These data are illustrated from A (turn 1); B (turn 2); C (turn 3) and D (turn 4). The mean SGN soma area for normal hearing cochleae are also illustrated. The mean SGN soma area for deafened, untreated control cochleae are illustrated by the dashed line. Error bar = standard error of the mean.