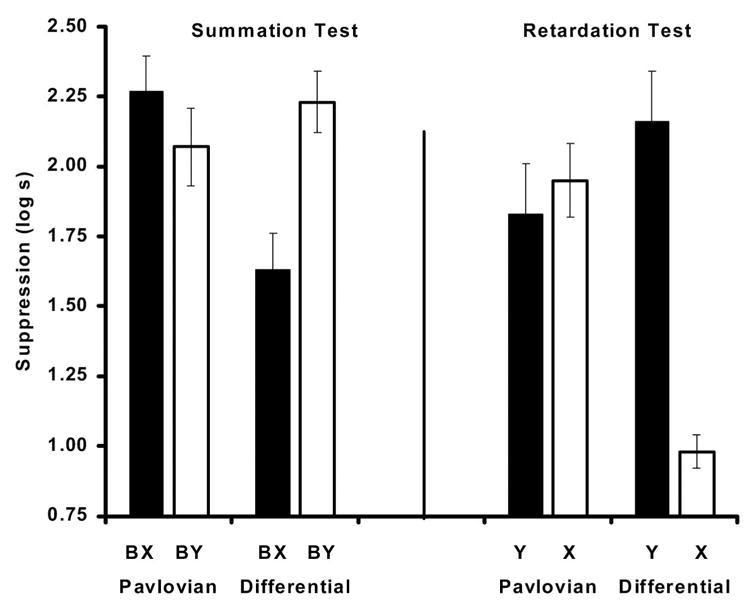
Figure 3.

Mean times to complete 5 cumulative seconds of drinking upon presentation of the target CS in Experiment 2. Left: Results of the summation test. Right: Results of the retardation test. Note that subjects that served as controls for the summation test (Ret groups) were the target groups for the retardation test, and vice versa. See Table 1 for the treatments of the four groups.
