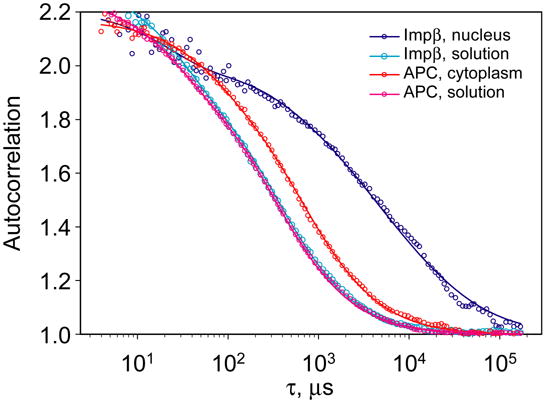
Figure 2. FCS analysis of allophycocyanin and importin β in vitro and in vivo.

Autocorrelation functions for APC and importin β labeled with Alexa Fluor 647 were measured in vitro and inside live cells and normalized. Autocorrelation data for both APC and importin β in vitro were fitted with a single decay time τ = 300 μs. Autocorrelation data for APC in vivo was fitted with a decay time τ = 1000 μs. Autocorrelation data for importin β in vivo required multiple decay times for an adequate fit.
