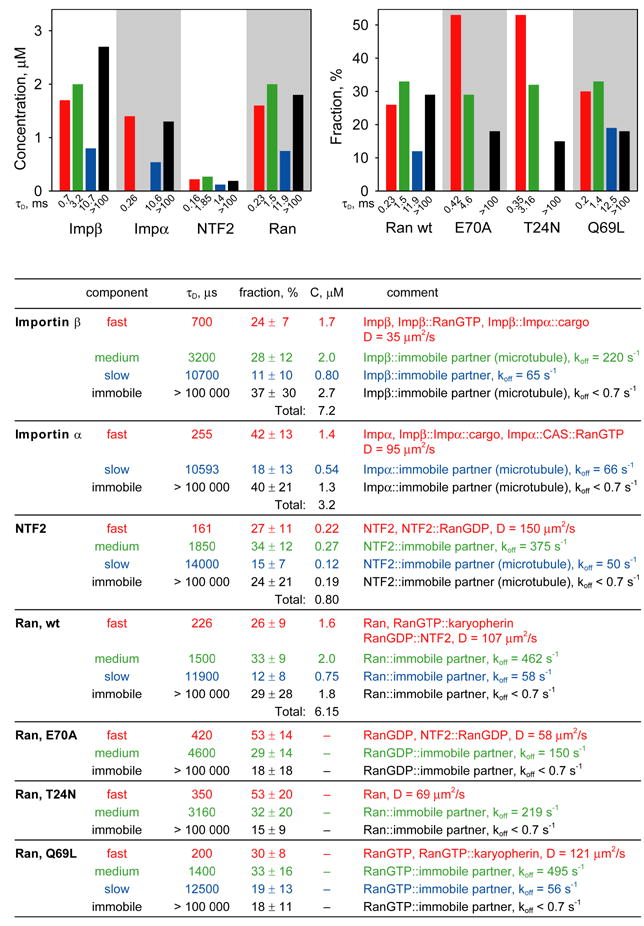
Figure 5. FCS analysis of nuclear transport proteins in cytoplasm.

Mobilities of microinjected nuclear transport proteins in cytoplasm were analyzed by FCS. For each protein at least 20 cells were analyzed. Autocorrelation data from all cells were globally fitted to resolve protein populations with different mobilities. Immobile fraction for each protein was determined from photobleaching amplitudes. Concentrations for each population were calculated based on total concentration and nucleocytoplasmic distribution of endogenous protein. Concentrations of each component are shown on bar graphs and in the table. Fast, medium, slow and immobile populations are labeled with red, green, blue, and black colors respectively. For mutant Ran proteins, the fraction of each population is shown compared with wt Ran. The table shows autocorrelation decay times (τD), fractions, and concentrations for each population. Molecular species comprising each population and calculated diffusion coefficients or off rates are listed.
