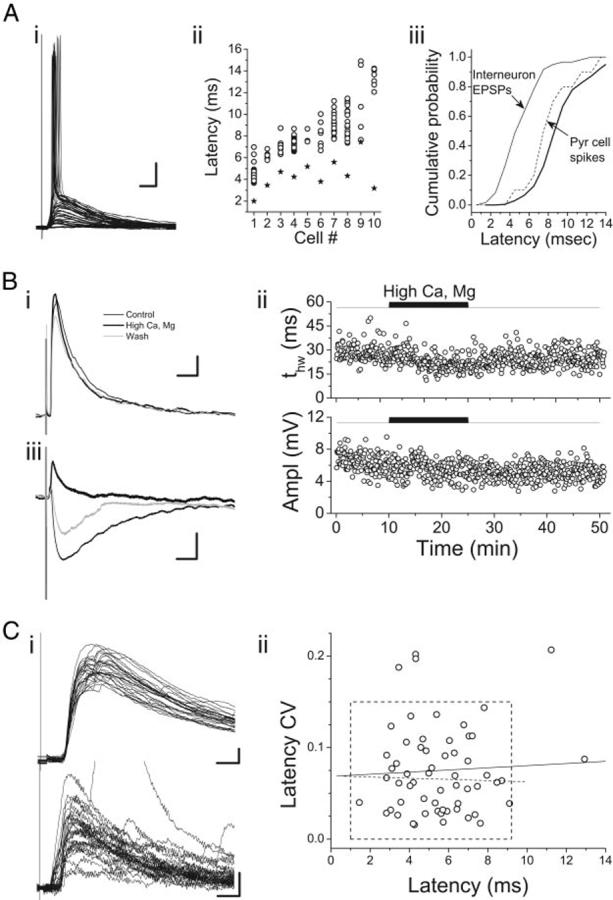
FIG. 2.

Distinguishing monofrom polysynapt1ic synaptic responses to thalamic stimulation. A: spike latencies in layer II-IV pyramidal cells. Raw responses of a single pyramidal cell (i) and spike latencies for 10 cells (ii, open circles) in which thalamic stimulation was superthreshold. Multiple symbols for each cell represent latency measurements in different trials. Also shown in ii are mean EPSP latencies for each cell (stars). Cells are ordered along the horizontal axis according to mean spike latency. In iii, cumulative latency distributions are shown for excitatory postsynaptic potentials (EPSPs) in interneurons (thin solid line) and spikes in pyramidal cells (thin dashed line). Thick solid line is the distribution of pyramidal cell spike latencies smoothed and shifted 1 ms to the right, representing the estimate of disynaptic EPSP latencies expected from the pyramidal cell spike latency data. Resting potential for the cell in i was -72.6 mV. Scale bars: 10 ms, 10 mV. B: effects of elevated extracellular divalent cations on synaptic responses in auditory thalamocortical (TC) slices. Bi: average synaptic response to TC stimulation in a layer II interneuron from a primary slice in control (thin black trace), 4 mM [Ca2+] and 4 mM [Mg2+] (thick black trace), and recovery (gray trace). Resting potential, -76.1 mV. Bii: time-series plot of EPSP duration (tHW) and amplitude for the same experiment as in Bi. Biii: average synaptic response to stimulation in the white matter of a layer IV pyramidal cell in control (thin black trace), 4 mM [Ca2+] and 4 mM [Mg2+] (thick black trace), and recovery (gray trace). Cell was held at -50 mV during the stimulation to make the disynaptic inhibitory postsynaptic potential (IPSP) visible. Scale bars: 25 ms, 1 mV. C: analysis of the variability of response latency in interneurons. i: 2 example responses to TC stimulation, 1 with low LatCV(top; LatCV = 0.02; ERest =-66.1 mV; layer II/III interneuron) and 1 with high LatCV (bottom; LatCV = 0.20; ERest =-67.6 mV; layer II/III interneuron). ii: mean LatCV as a function of LatMn for all 60 interneurons exhibiting responses to thalamic stimulation. Dashed box, boundaries of putative monosynaptic responses, i.e., LatCV<0.15 and LatMn <9.25 ms. Dashed line, linear regression fit to the data within the dashed box. Solid line, linear regression fit to all of the data. Neither line had significant nonzero slope.
