
FIG. 4.
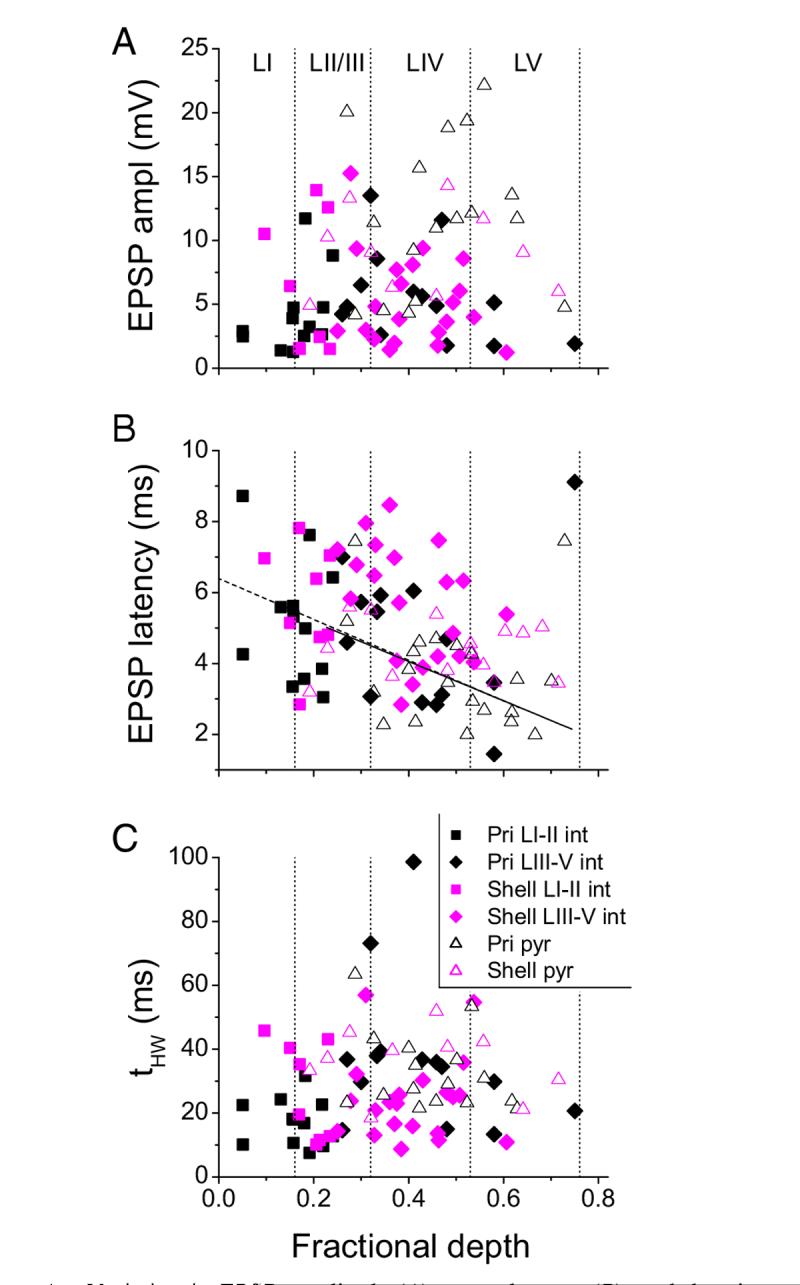
Variation in EPSP amplitude (A), mean latency (B), and duration (tHW; C) with cortical depth for interneurons (closed symbols) and pyramidal cells (open triangles) from primary slices (black) and from shell slices (magenta). Depth was normalized to the distance in each slice from the pia to the white matter. There was no significant correlation for any parameter for either cell type except for mean latency in primary interneurons (B, dashed line; r =-0.504, P < 0.05) and primary pyramidal cells (B, solid line; r = -0.522, P < 0.05). Vertical dotted lines, boundaries of the cortical layers as indicated in A.