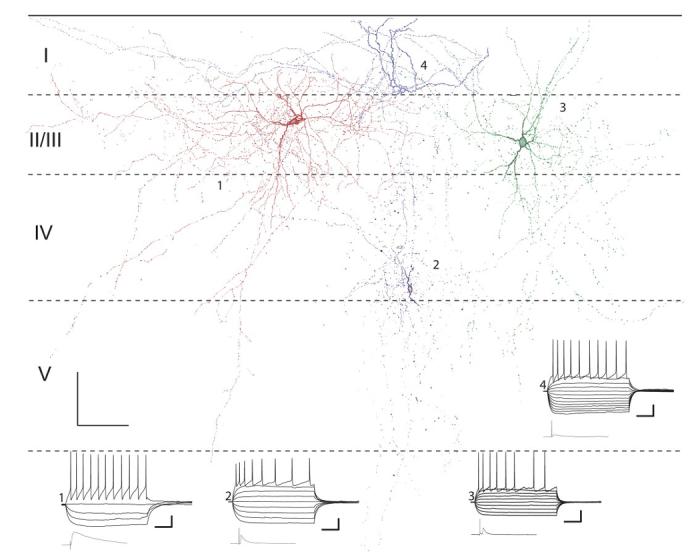
FIG. 6.

Camera lucida reconstructions of 4 interneurons in primary slices. Horizontal dashed lines, layer boundaries. Also shown are current clamp responses to polarizing current steps and mean maximal responses to TC stimulation (bottom left). Physiology traces and cells are numbered, starting with the red cell in layer II (1) and proceeding counterclockwise with the blue cell in layer I being number 4. Resting potentials (clockwise, from top): -72.4, -69.1, -75.0, and -70.9 mV. Current steps ranged from -200 to 0 pA for hyperpolarizing pulses and in increments of 75 pA until threshold. The pulse eliciting the superthreshold response varied between cells but was typically 375 pA. Scale bars: 100 μm, 100 μm (anatomy figure), 50 ms, 20 mV (current pulse responses), 25 ms, 6 mV (TC stim responses).
