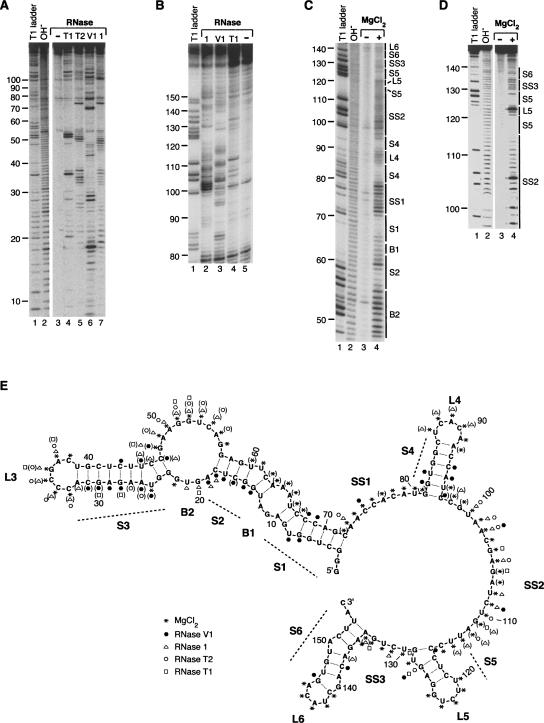
FIGURE 2.
A model for the secondary structure of B2 RNA derived from RNase and in-line probing experiments. (A) Representative RNase probing data. Lanes 1 and 2 show the denaturing RNase T1 ladder and the alkaline hydrolysis ladder, respectively. Lanes 4–7 show the pattern of products resulting from treatment of 5′ 32P-labeled full-length B2 RNA with RNase T1 (unpaired GpN), RNase T2 (unpaired Ap>Np), RNase V1 (double-stranded RNA), and RNase 1 (unpaired NpN), respectively. The control in lane 3 shows the background pattern of bands for untreated B2 RNA. (B) Representative RNase probing data showing resolution of the 3′ end of B2 RNA. Lane 1 shows the denaturing RNase T1 ladder. Lanes 2, 3, 4, and 5 show digestion with RNase 1, RNase V1, RNase T1, and the undigested control, respectively. (C) Representative in-line probing data. Lanes 1 and 2 show the denaturing RNase T1 ladder and the alkaline hydrolysis ladder, respectively. Lane 4 shows the pattern of bands resulting from incubating 5′ 32P-labeled full-length B2 RNA under in-line probing conditions. The control in lane 3 shows the background pattern of bands for untreated B2 RNA. (D) Representative in-line probing data of B2 RNA(75–149). Lanes are as described for C. (E) Model for the secondary structure of B2 RNA. Nucleotides 1–155 of B2 RNA are shown. Nucleotides 156–178, which constitute an A-rich single-stranded 3′ tail, are not shown in the model. The data from multiple experiments are summarized on the model according to the legend. Symbols in parentheses indicate positions cleaved only weakly. Predominant features in the secondary structure are labeled as: stems 1–6 (S1–S6), bulges 1 and 2 (B1 and B2), loops 3–6 (L3–L6), and single-stranded regions 1–3 (SS1–SS3).

