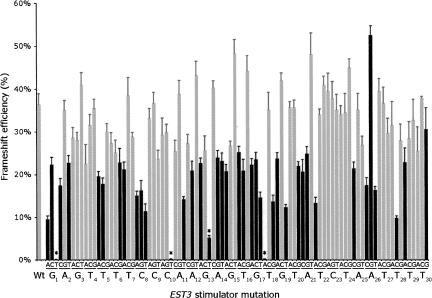
FIGURE 4.
Missense mutagenesis of the EST3 stimulator. Each bar represents β-galactosidase activity (±SEM) expressed from a reporter involving a wild-type (Wt) or missense mutant EST3 stimulator. Each wild-type nucleotide appears below the graph with a subscript indicating the position; the identity of each tested mutation appears just above in groups of 3. Black bars represent results judged by T-test as different from wild type (P ≤ 0.005). Asterisks indicate mutations that introduce an in frame nonsense codon, which strongly reduces expression of lacZ.

