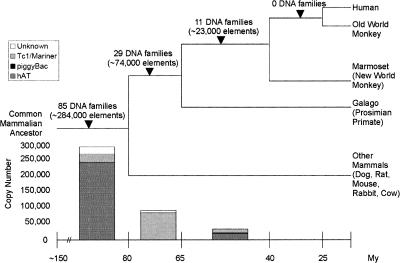
Figure 3.
Summary of the activity of DNA transposons through primate evolution. The bar graph at the bottom of the figure represents the number of DNA elements active during each major lineage, broken down per superfamily. Note that no DNA elements were found to be active after the emergence of new world monkeys.

