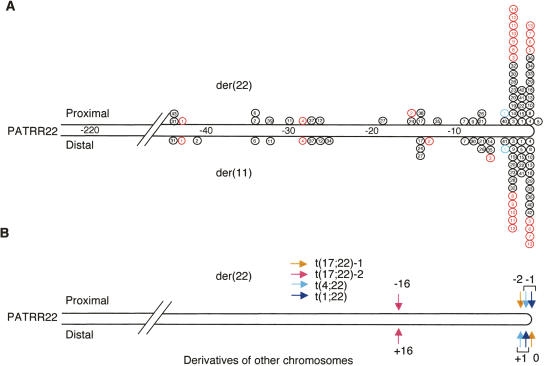
Figure 3.
Localization of the translocation breakpoints within the PATRR22. (A) Mapping of the t(11;22) breakpoints on the PATRR22. Each circle represents the breakpoints of the der(22) (top) and the der(11) (bottom). The scale indicates nucleotide number from the center of the PATRR22. The numbers in the circles indicate each individual translocation carrier. Black circles are from Kurahashi et al. (2000b), red from Edelmann et al. (2001), and blue from Tapia-Paez et al. (2001). Samples 38, 39, 43 (black), and 14 (red) have only the der(22) breakpoint, since they are from patients with the supernumerary-der(22) syndrome. It is noteworthy that the majority of balanced carriers show similar breakpoint locations on the PATR22 for the der(11) and the der(22). (B) Mapping the breakpoints of other translocations involving the 22q11 PATRR.

