
Figure 9.
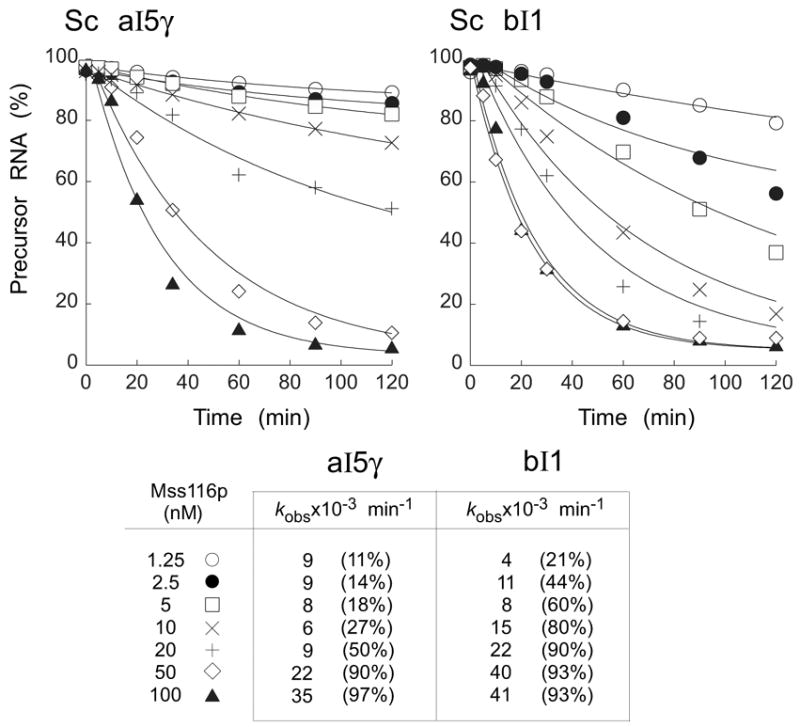
Mss116p-concentration dependence of aI5γ and bI1 group II intron splicing. Splicing time courses for aI5γ (left) and bI1 (right), respectively, were done with 20 nM 32P-labeled precursor RNA and 1.25 to 100 nM Mss116p in reaction media containing 100 mM KCl and 8 mM MgCl2 at 30°C. The plots show disappearance of precursor RNA as a function of time, with data fit to a single exponential. The table at the bottom summarizes kobs values and amplitudes (%) at 120 min. Abbreviations are as in Figure 7.