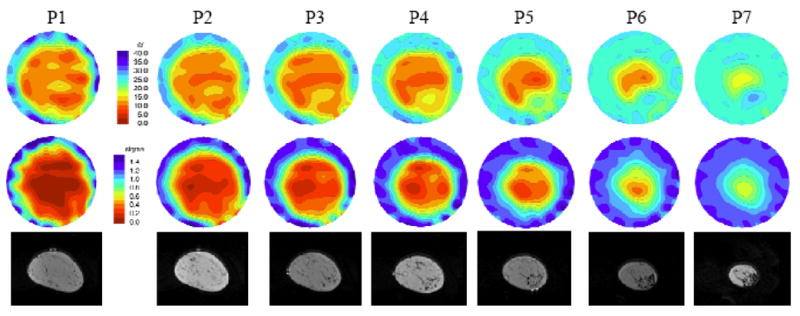
Figure 10.

Microwave (top row – permittivity and middle row – conductivity at 1100MHz) and coregistered MR (bottom row) images in the same anatomically coronal view for the left breast of a woman with fatty to scattered radiographic density. P1 though P7 (labels above each image column) indicate microwave tomograms spaced 1 cm apart beginning near the chestwall.
