Figure 8.

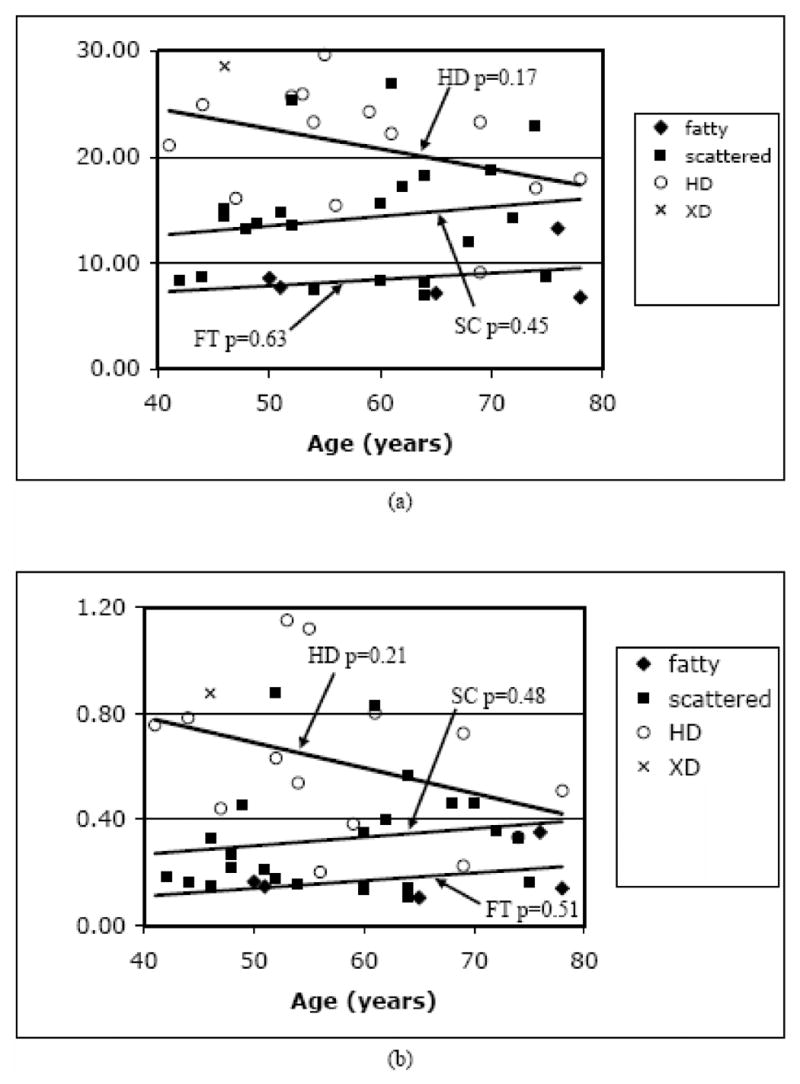
Scatter plots of the 1300 MHz fibroglandular average (a) permittivity and (b) conductivity values grouped by radiographic density and graphed as a function of patient age. P-values for the trend lines are shown for each density category.

Scatter plots of the 1300 MHz fibroglandular average (a) permittivity and (b) conductivity values grouped by radiographic density and graphed as a function of patient age. P-values for the trend lines are shown for each density category.