
Figure 3.
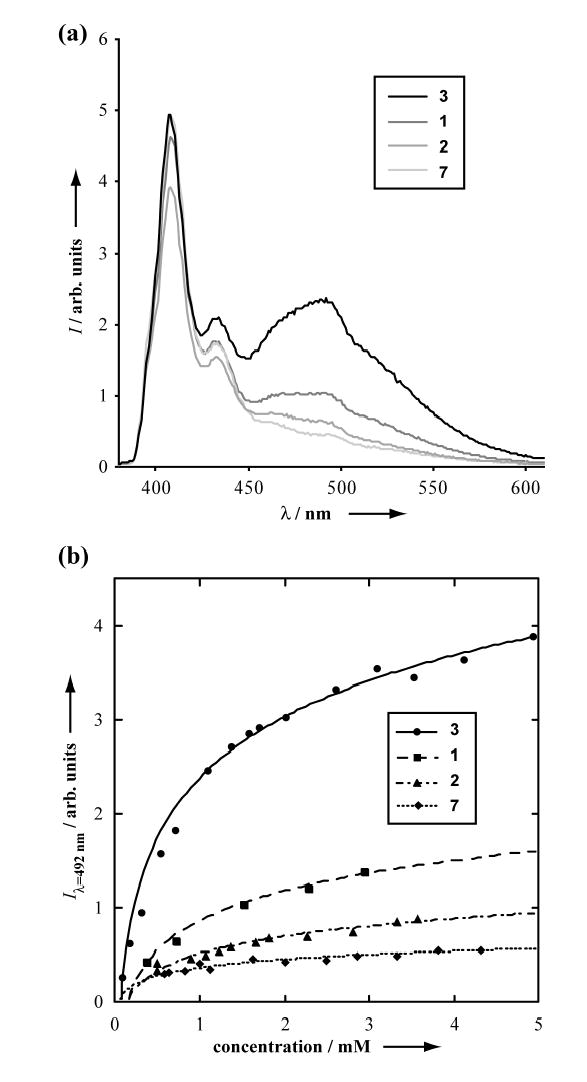
(a) Fluorescence spectra of 1.65 mM solutions of peptides 1, 2, 3, and control compound 7 in CDCl3 (λex = 330 nm); (b) the change in excimer intensity as a function of peptide concentration (lines are shown to guide the eye).
Official websites use .gov
A
.gov website belongs to an official
government organization in the United States.
Secure .gov websites use HTTPS
A lock (
) or https:// means you've safely
connected to the .gov website. Share sensitive
information only on official, secure websites.
(a) Fluorescence spectra of 1.65 mM solutions of peptides 1, 2, 3, and control compound 7 in CDCl3 (λex = 330 nm); (b) the change in excimer intensity as a function of peptide concentration (lines are shown to guide the eye).