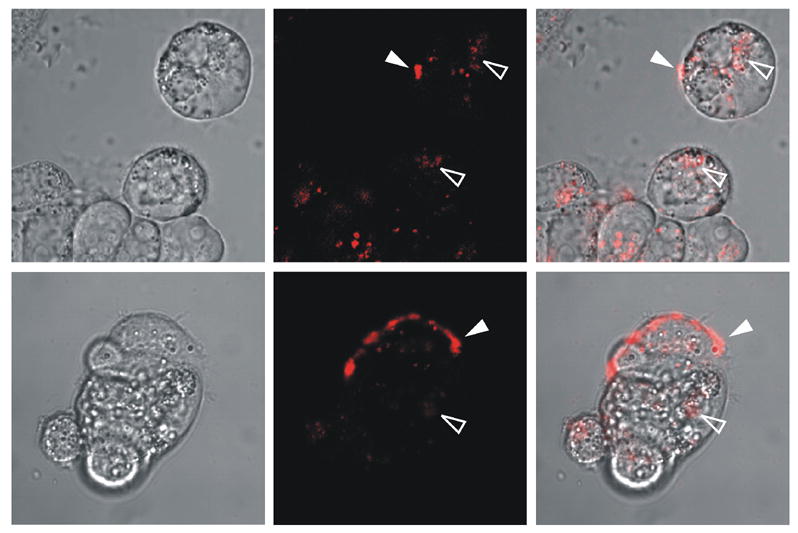
Figure 3.

Confocal laser scanning microscopy images of Caco-2 cells incubated with rhodamine-HD-5. Cells were incubated in serum-free RPMI medium for 3 hours with 10 μg/ml of the peptide and were gently washed twice with HBSS prior to imaging. Left panels show the bright field image, middle panels show the fluorescence image of the rhodamine-labeled peptide, and right panels are a superposition of the two images. The fluorescence image is a 1-μm optical section acquired approximately at the equator of the largest cells, which are typically 14 – 15 μm in thickness. Filled arrowheads indicate examples of surface labeling; open arrowheads indicate examples of internalization.
