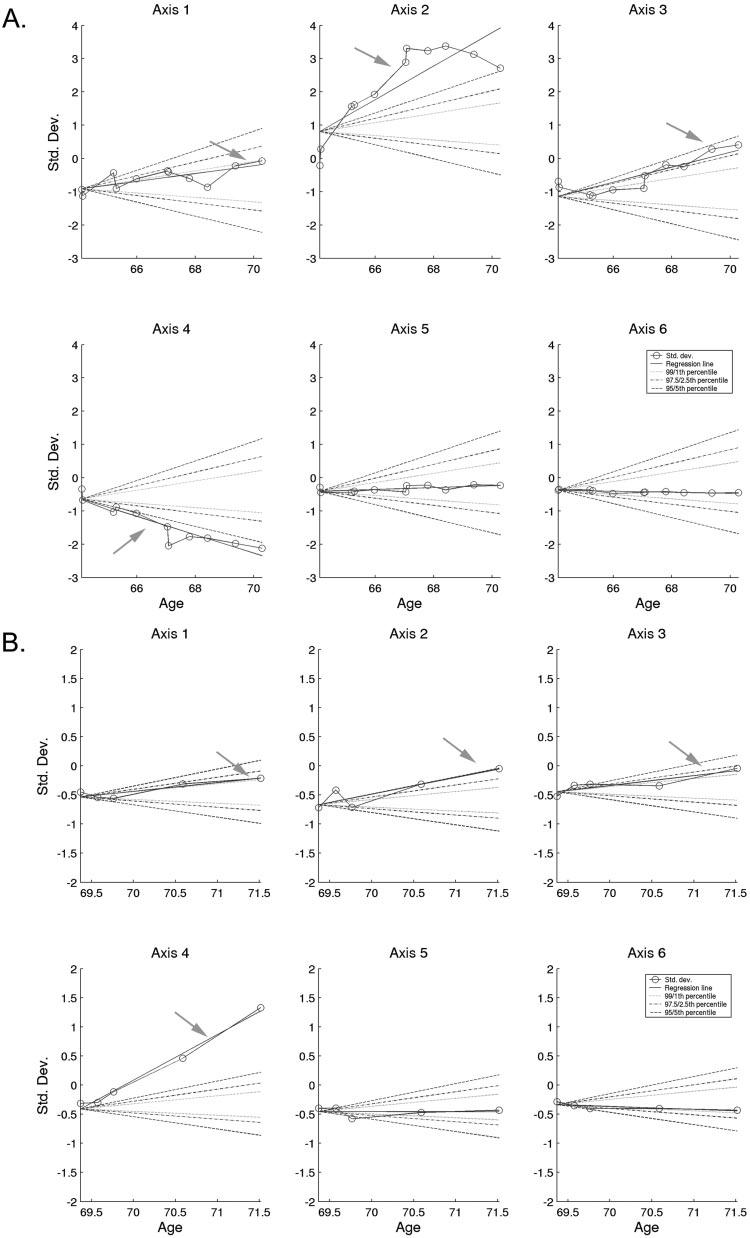
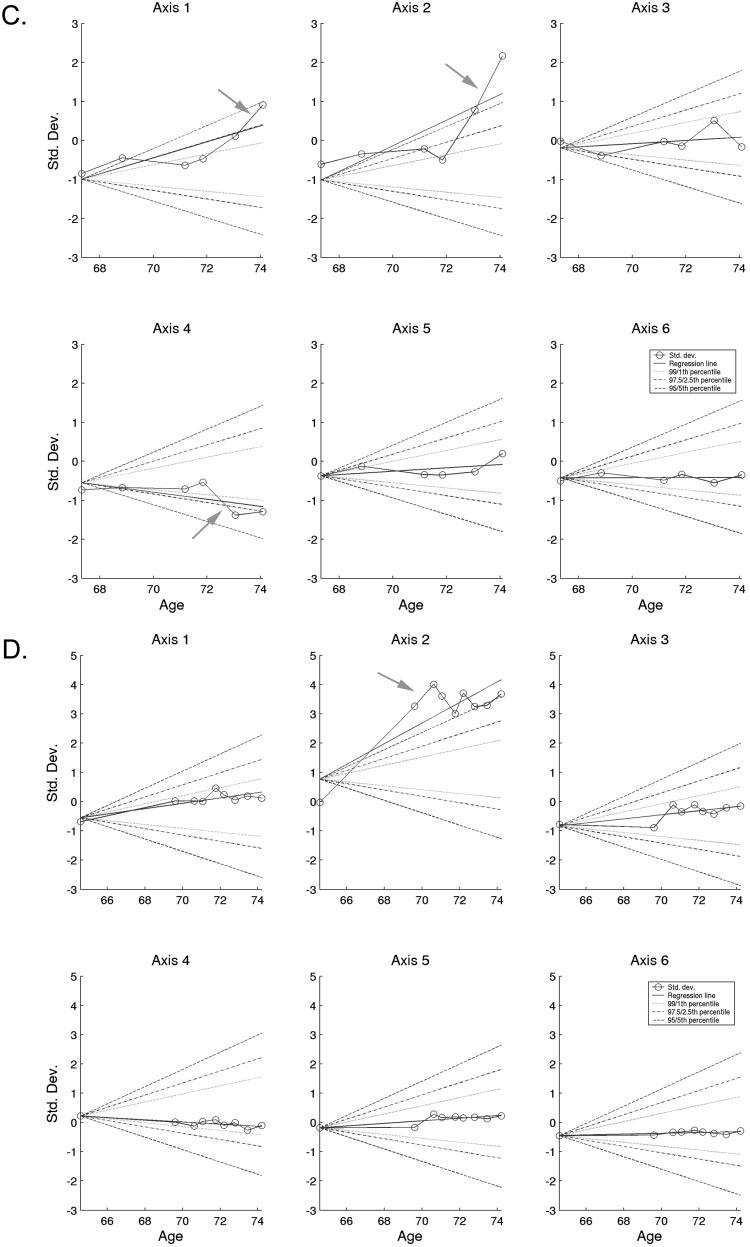
Figure 4.


Each box holds axis results for the entire set of fields from a patient. The pale lines depict percentile ranges 95, 97.5, and 99 ranges. The wavy lines are the actual result of the classification and the darker straight line is the regression line fit to the data. Arrows within each axis panel: data falling outside the percentile limits for no change (i.e, progression). (A) Results from a patient with visual field loss without GON; (B) an ocular hypertensive; (C) a patient with GON and no visual field loss; and (D) a patient with GON and visual field loss. Note that for this participant, there was a 5-year interval between the first and second field tests, which might exaggerate change along the axis. Change would disappear if the first field were not included. This time lapse does not mean, however, that there was no progression between the first and second field tests. A review of the actual fields shows on field 1 a nasal step on the pattern deviation plot encompassing five points at P < 0.05 and one at P < 0.01. The second field shows a full arcuate defect that included those six points all at P < 0.05. This participant was lost to the study during the break between field tests, but a review of the medical records showed that the physician noted progression and performed an argon laser trabeculoplasty in 1989. In 1992 he noted a disc hemorrhage, progression and did a trabeculectomy. The patient’s glaucoma was considered stable for the remainder of the years through 1998.
