
Figure 1.
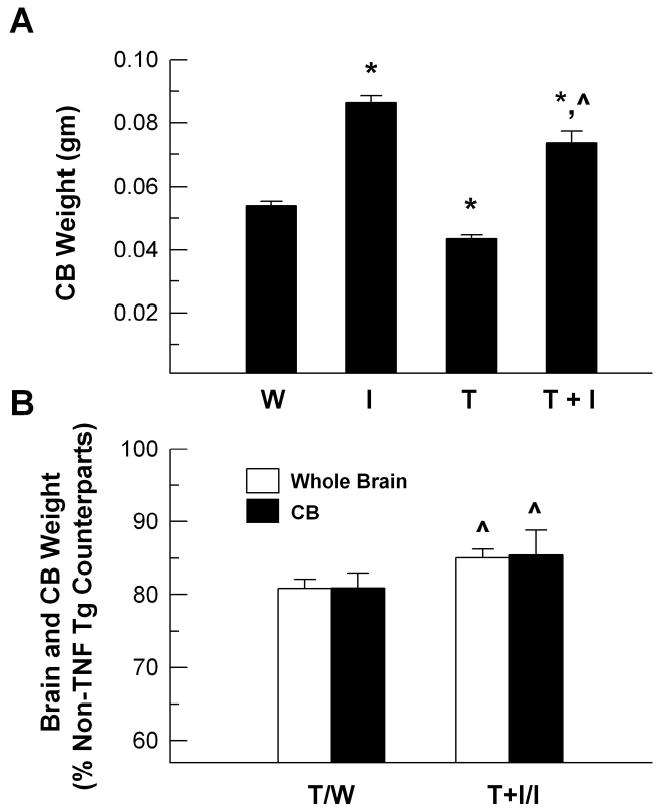
Cerebellum and whole brain weights of 8–10 week old WT (W), IGF-I Tg (I), TNF-α Tg (T), and TNF-α/IGF-I Tg (T+I) mice. Panel A. Cerebellar (CB) weight is expressed as percentage of that of WT mice. Panel B. CB, as well as whole brain, weights of TNF-α Tg (T) and TNF-α/IGF-I Tg (T+I) mice are expressed as the percentage of their non-TNF-α Tg counterparts, respectively. The values represent mean ± SE from 5 – 6 mice. *, P<0.05, compared to WT controls. ^, P <0.05, compared to TNF-α Tg mice.