
Figure 9.
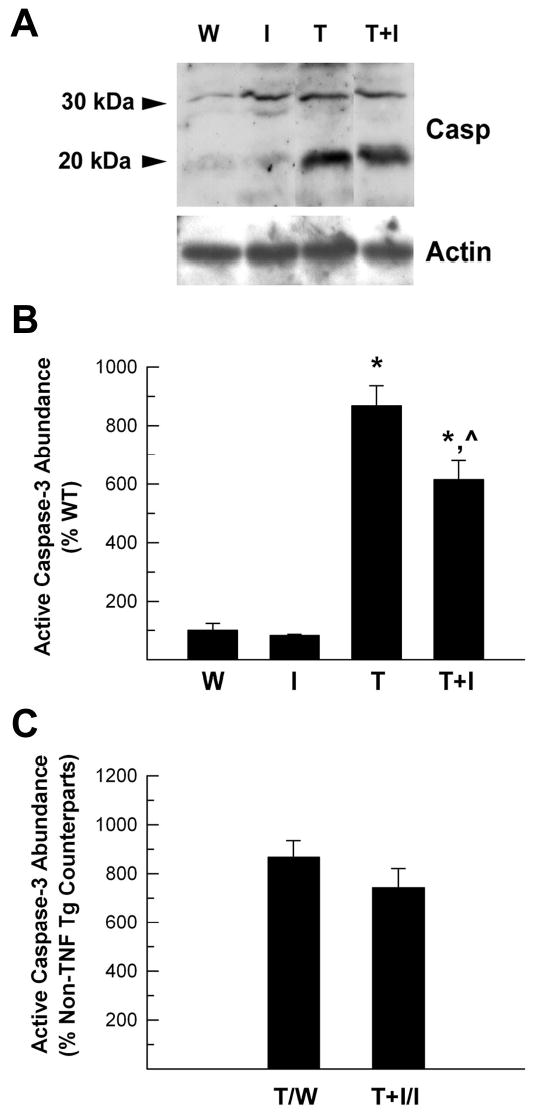
Abundance of active caspase-3 in cerebellum of TNF-α Tg mice and TNF-α/IGF-I Tg mice. Proteins derived from WT (W), IGF-I Tg (I), TNF-α Tg (T), and TNF-α/IGF-I Tg (T+I) mice were subjected to western immunoblot analysis. Panel A. Representative caspase-3 western immunoblot. Two arrows at the right of the panel point to pre-caspase-3 (30 kDa) and active caspase-3 (20 kDa) bands, respectively. The lower panel shows actin bands. Panel B. Quantification of active caspase-3 abundance. The abundance of active caspase-3 is expressed as the percentage of that in WT mice. Panel C. The abundance of active caspase-3 shown in panel B is expressed as the percentage of their non-TNF-α Tg counterparts, respectively. The values represent mean ± SE from 3 – 4 mice. *, P<0.05, compared to WT mice. ^, P<0.05, compared to TNF-α Tg mice.