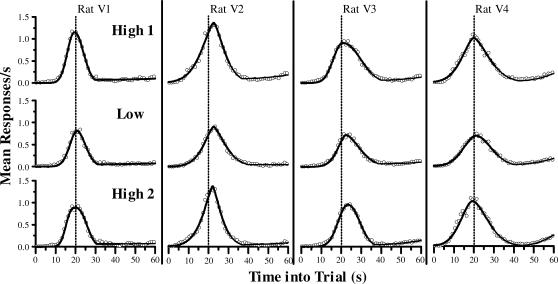
Fig 2. Mean response rate as function of time into peak trial for each rat in each reinforcer condition in 1-s bins.
Each column presents data from an individual rat. Each row presents averaged data from the final five sessions for each of the three levels of reinforcer magnitude (High 1, Low, and High 2). The curves plot the result from the best-fitting Gaussian model (DGKQ: Dual Gaussian with a Kurtosis factor and Quadratic tail; see Methods) to the response-rate data. The dotted line in each plot represents the time at which reinforcement was available to rats on nonpeak trials (20 s).

