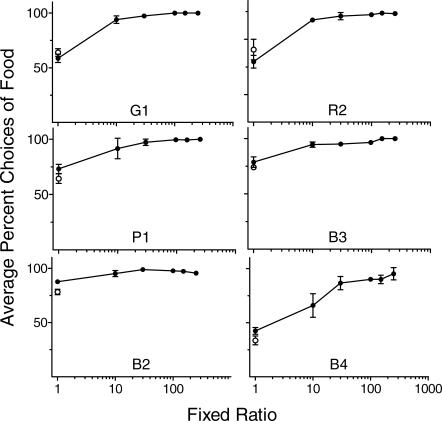
Fig 6. Percentage choice for the food reinforcer across the ratio values arranged.
Choices are averaged over the final four sessions of the concurrent schedule phase and error bars correspond to one standard deviation in both directions. Open circles at FR 1 show averaged choices in the replication.

