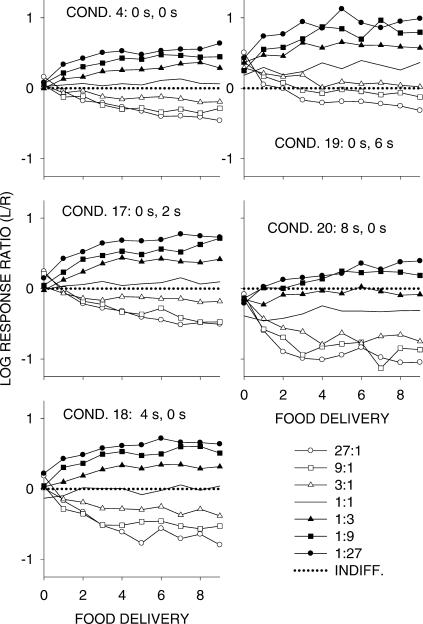
Fig 1. Phase 1.
Log Left/Right response ratios in each of the seven components as a function of increasing numbers of component food deliveries. The data were grouped over the 5 pigeons. The dotted line represents indifference (equal choice). Appendix Figure A1 shows individual-pigeon results from Condition 20.

