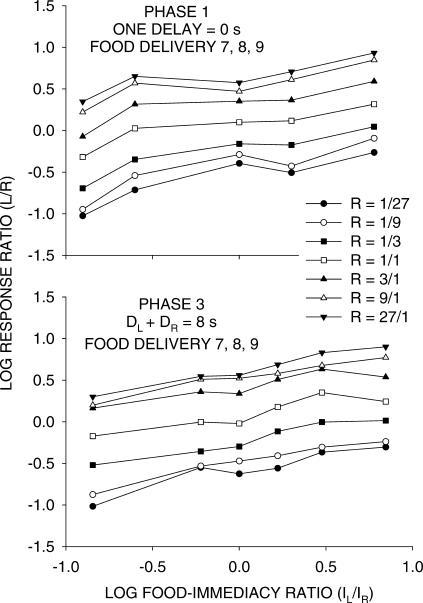
Fig 4. Phases 1 and 3.
Group choice as a function of relative delay from the last three food deliveries in components. Log Left/Right response ratio as a function of the Left/Right immediacy ratio (varied over conditions) according to the log food ratio (varied within sessions). Because the pigeons took an unknown time greater than 0 s to reach the food magazine, the preferences shown in the upper graph (Phase 1) have ordinal significance only, and the shapes of the functions are arbitrary. In Phase 3 (lower graph), the minimum delay was 1 s, presumably longer than the time pigeons took to move to the food magazine.

