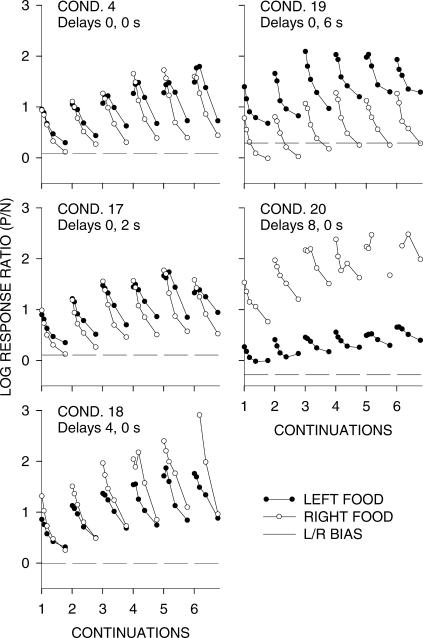
Fig 6. Phase 1.
Group log response ratios to the just-productive alternative (P/N) following food on the left and right keys, and overall log Left/Right response ratios, in each condition. The response numbers were grouped: all first responses, then second and third responses, then Responses 4 through 7, then Responses 8 through 15, and then Responses 16 through 31. Each successive plot on a graph shows response ratios after 1, 2, 3, etc. successive food deliveries from the same alternative. The dashed line represents the overall Left/Right bias in each condition. Appendix Figure A2 shows individual-pigeon results from Condition 17 and 18.

