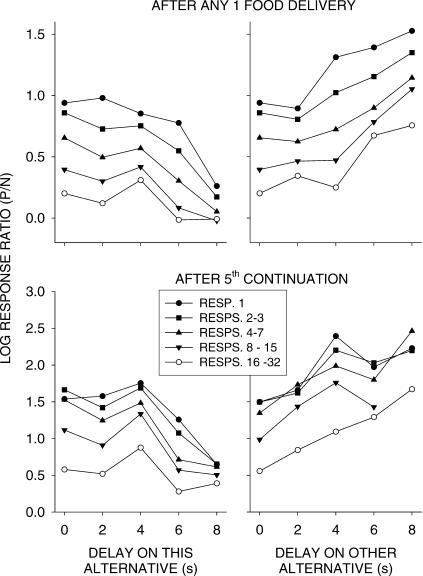
Fig 7. Phase 1.
Group log response ratios to the just-productive alternative (P/N) as a function of delay (left graphs) and, for the 0-s delay alternative, as a function of delay on the other alternative (right graphs). Upper graphs show performance after any single food delivery, and lower graphs after five continued same-alternative food deliveries. Preferences are shown at selected response-number bins after food.

