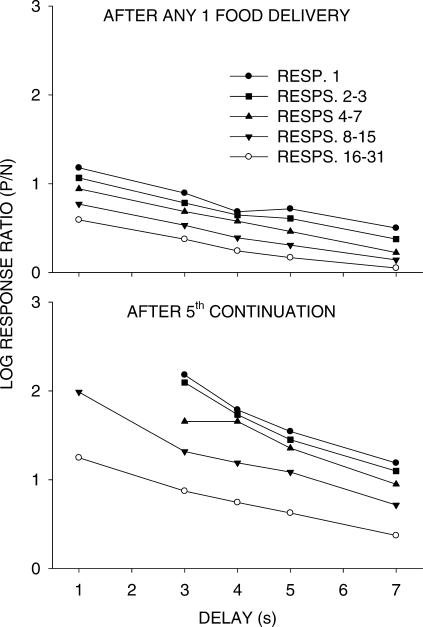
Fig 15. Phase 3.
Log P/N response ratios as a function of delay duration at selected response number bins after food. The upper graph shows choice after any single food delivery, and the lower graph after five continued food deliveries on an alternative. The group data are the same as those used in Figure 14.

