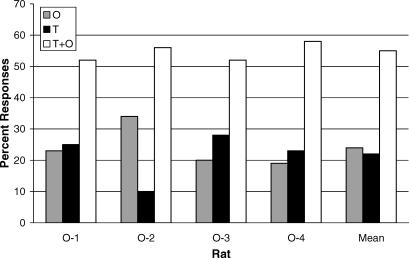
Fig 3. The distribution of tone, odor, and tone-plus-odor (T+O) responses on the stimulus compounding test.
Percentages were calculated for each subject by dividing the responses emitted to each test condition by the total responses emitted to T, O, and T+O summed over the test, and then multiplying by 100. Mean test percentages are presented to the right.

