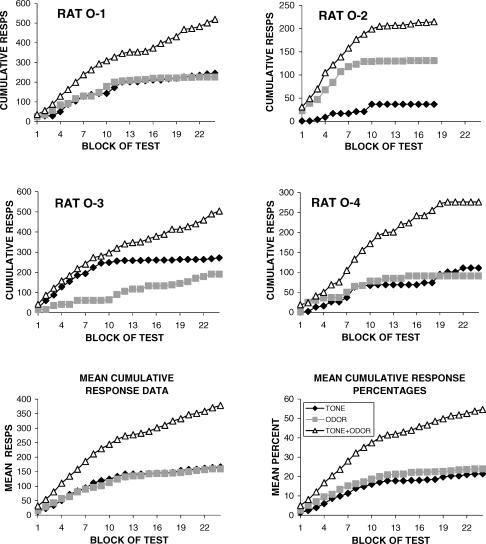
Fig 4. The upper four graphs present the total test responses emitted by individual rats accumulated over each block-randomized presentation of Tone, Odor, and Tone+Odor.
Mean cumulative response data are presented in the lower left graph. The lower right graph presents the mean data in terms of mean cumulative response percentages that weights all animals comparably irrespective of their absolute response rate (see text for details of how these percentages were calculated).

