Figure 1.
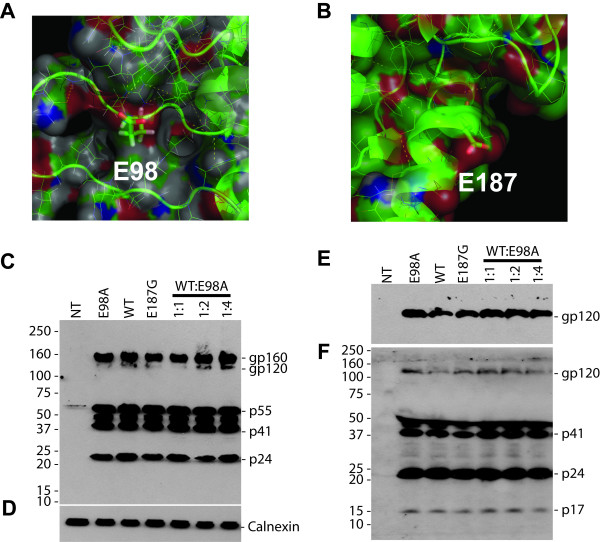
Structural view and Western blot analysis of capsid mutants. A close view of the structure of the cyclophilin A binding loop in the N-terminal (A) and the position of E187 in the C-terminal (B) HIV-1CA domains. The two residues in this study, E98 and E187, are being explicitly highlighted. The figure was produced with PyMOL [27] and the structure was obtained from the Protein Data Bank (cf PDB entry 1E6J [3]). (C to F) Western blot analysis of mutant and wild-type pNL4-3 transfected cells (C and D), and viral lysates (E and F). HeLa-tat cells were transfected as indicated with 2 μg of proviral DNAs using the non-liposomal FuGENE transfection reagent (Roche) as recommended by the manufacturer. Cells were also co-transfected with mutant and wild-type pNL4-3 as indicated. Forty-eight to 72 hrs post-transfection, cells were harvested and proteins were separated by SDS-PAGE in 4–12% gels and transferred to a nitrocellulose membrane. The membranes were initially probed with HIV+ patient serum (C and F) and were then reprobed with rabbit anti-calnexin antibody (D) or mouse monoclonal anti-V3 antibody (E) using horseradish peroxidase-conjugated secondary antibodies raised against mouse (DAKO, 1:4000), human (Pierce, 1:20,000), or rabbit (Sigma, 1:4,000) IgG. The protein bands were visualized by chemiluminescence. The positions of specific viral proteins are indicated to the right. Numbers to the left depict positions of molecular mass markers in kDa.

