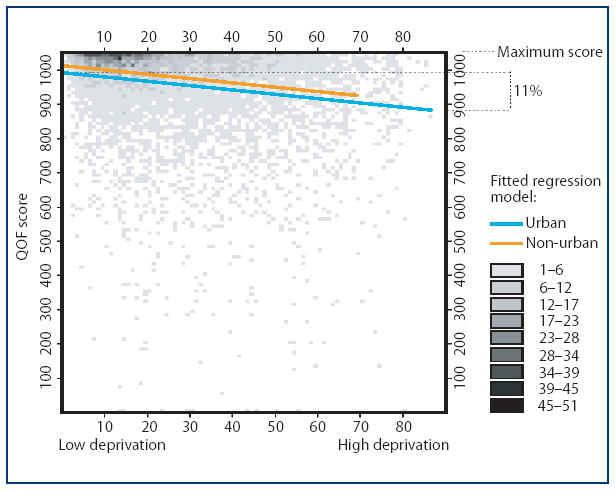
Figure 1.

Relationship between overall Quality and Outcomes Framework score and the Office of the Deputy Prime Minister's Indices of Deprivation (ID2004) (the dotted line shows the fitted regression model for urban practices and the solid line shows the fitted regression model for village and town practices).
