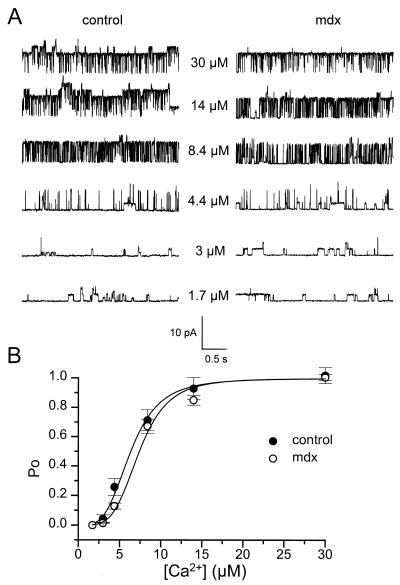
Figure 1.
Comparison of Ca2+ sensitivity of KCa channels in inside-out patches from control and mdx muscle fibers. (A) Segments of single KCa channel currents recorded in the presence of increasing intracellular free [Ca2+] indicated next to each current trace. The membrane potential was held at 0 mV. (B) Relationships between open probability and intracellular free [Ca2+] in control (●; n = 14) and mdx (○; n = 19) patches. In each patch, values of Po were normalized to the value obtained in the presence of 2.5 mM intracellular Ca2+. The curves were fitted by using a Hill equation with n = 3.6 and K = 6.3 μM in control and n = 4.2 and K = 7.4 μM in mdx patches, respectively (see text).

