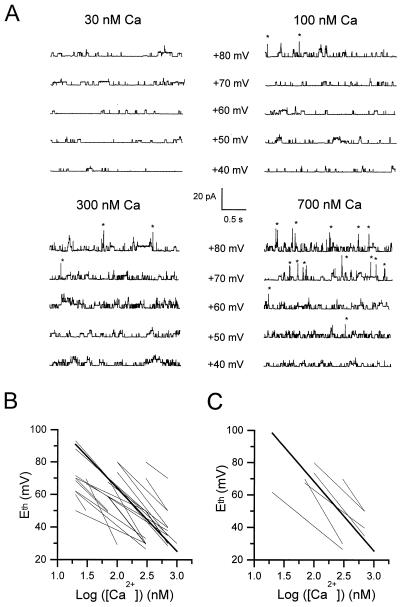
Figure 5.
Measurement of Eth in inside-out patches from control muscle fibers in the presence of increasing concentrations of intracellular free Ca2+. (A) Segments of current traces obtained in response to voltage pulses given at values indicated next to each trace from a holding potential of 0 mV in the presence of 30, 100, 300, and 700 nM Ca2+. Asterisks indicate opening of KCa channels. (B) Whole set of linear fits between Eth and logarithm of [Ca2+] in 22 patches (thin lines); the bold line corresponds to the mean fit with a slope of −38.65 (see text), which has been arbitrarily positioned on the graph; data points are not shown for clarity. (C) Whole set of linear fits between Eth and logarithm of [Ca2+] in six one-channel containing patches (thin lines); the bold line corresponds to the mean fit with a slope of −42.8 and a constant value of 154 (see text); data points are not shown for clarity.

