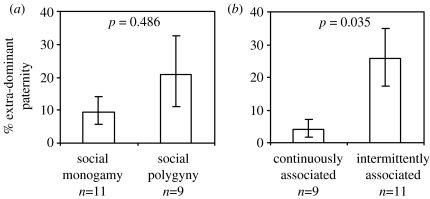
Figure 1.
Mean (±1 s.e.) %EDP in species with (a) contrasting breeding systems and (b) contrasting patterns of association between males and females. The same 20 EDP estimates (see table 1) were used in both panels. p-values shown are from a linear model with %EDP as the response variable and with both breeding system and association pattern as explanatory variables (see §3).

