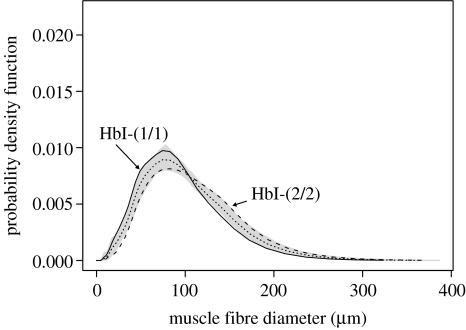
Figure 2.
Probability density functions of fibre diameter for five HbI-(1/1) (solid line; 45.3±1.0 cm fork length) and five HbI-(2/2) (dashed line; 45.8±0.9 fork length) haemoglobin phenotypes (mean±s.e.). The dotted line shows the average pdf of fibre diameters across all genotypes and the shaded area 100 bootstrap values of the combined population of diameters.

