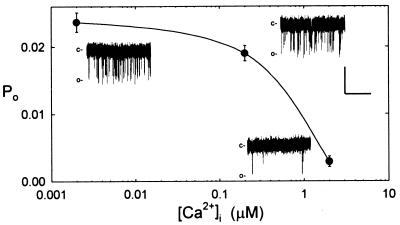
Figure 3.
Po is suppressed by micromolar [Ca2+]i. Means ± SE of Po from mean open times of 100-s recordings at −120 mV (n = 3). Ca2+ added on the cytosolic side (inside) during inside-out recordings against a background of 30 mM Ba2+ and with 10 mM Ba2+ outside. (Insets) Segments of traces at each [Ca2+]i. Data from one patch. Scale: vertical, 1 pA; horizontal, 1 s.

