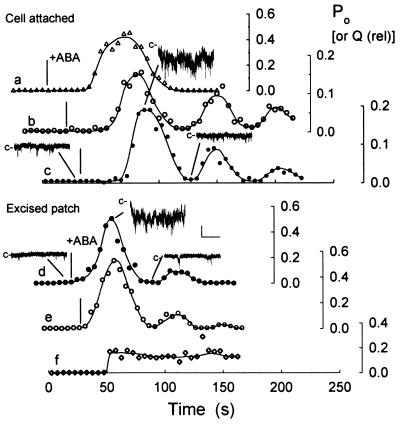
Figure 5.
ABA, but not voltage steps, evokes oscillations in Ca2+ channel activity. Po (data points) and relative net charge, Q (solid lines), calculated at consecutive 5-s intervals in six independent experiments (a–f, three cell-attached, three excised, inside-out patches). Note the different Po scales (Right) for each experiment. Q calculated by summing all points above the zero current level during each 5-s interval and scaled to Po ranges. Segments of current traces c and d (including data from Fig. 4) with closed level (−c) as indicated. Scale: vertical, 2 pA; horizontal, 1 s. Times of ABA addition indicated (|, Left) in each experiment and aligned between c and e. Voltage stepped from −100 to −150 mV at 50 s in f.

